Instantcognition - blog.instantcognition.com

General Information:
Latest News:
From Athens to Beijing – A Look At Olympic Sprint Race History 5 Jul 2010 | 03:43 am
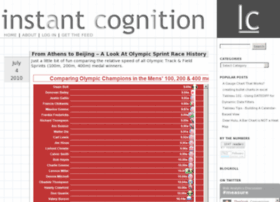
Just a little bit of fun comparing the relative speed of all Olympic Track & Field Sprints (100m, 200m, 400m) medal winners. Olympic Sprints Powered by Tableau Just how fast is Usain Bolt? He comp...
From Athens to Beijing – A Look At Olympic Sprint Race History 4 Jul 2010 | 11:43 pm
Just a little bit of fun comparing the relative speed of all Olympic Track & Field Sprints (100m, 200m, 400m) medal winners. Olympic Sprints Powered by Tableau Just how fast is Usain Bolt? He complete...
From Athens to Beijing – A Look At Olympic Sprint Race History 4 Jul 2010 | 08:43 pm
Just a little bit of fun comparing the relative speed of all Olympic Track & Field Sprints (100m, 200m, 400m) medal winners. Olympic Sprints Powered by Tableau Just how fast is Usain Bolt? He comp...
Math Infoviz Nature Short 22 May 2010 | 06:49 pm
Nature by Numbers from Cristóbal Vila on Vimeo. Infoviz pr0n
Math Infoviz Nature Short 22 May 2010 | 11:49 am
Nature by Numbers from Cristóbal Vila on Vimeo. Infoviz pr0n
Dear Hulu, A Bar Chart is NOT a Heat Map 14 May 2010 | 06:35 pm
Update: Smee correctly points out that while a Histogram and a Bar Chart are superficially similar, they are not really similar at all. I am properly chastised and have updated the post appropriately....
Dear Hulu, A Bar Chart is NOT a Heat Map 14 May 2010 | 02:35 pm
Update: Smee correctly points out that while a Histogram and a Bar Chart are superficially similar, they are not really similar at all. I am properly chastised and have updated the post appropriately....
Dear Hulu, A Bar Chart is NOT a Heat Map 14 May 2010 | 11:35 am
Update: Smee correctly points out that while a Histogram and a Bar Chart are superficially similar, they are not really similar at all. I am properly chastised and have updated the post appropriately....
Spot the Chart Lie – Alley Insider Edition 1 Jan 2010 | 08:45 am
Yesterday, the Alley Insider published the chart at left as their “Chart of the Day”. The chart shows trends in the number of people employed by the Newspaper industry from 1947 – September 2009 as es...
Spot the Chart Lie – Alley Insider Edition 1 Jan 2010 | 03:45 am
Yesterday, the Alley Insider published the chart at left as their “Chart of the Day”. The chart shows trends in the number of people employed by the Newspaper industry from 1947 – September 2009 as es...

