How Bulk Diesel Fuel Delivery Reduces Downtime for Industrial Operations 4 Jul 2:29 AM (3 months ago)
In high-demand industrial environments, even a small delay can snowball into serious operational losses. Downtime doesn’t just mean a few idle machines; it often leads to project setbacks, frustrated clients, and rising overhead. For industries that rely on fuel-powered machinery, such as construction, transportation, and manufacturing, bulk diesel fuel delivery has become a key solution to mitigate these risks.
Whether it’s a sprawling job site in South Texas or a remote oil field hours from the nearest gas station, the benefits of direct-to-site fueling are clear. Especially for businesses that depend on fleet fueling in Corpus Christi, having access to timely, efficient fuel delivery is vital for ensuring smooth and uninterrupted operations.
Let’s take a closer look at how bulk diesel fuel delivery helps reduce downtime and streamline industrial workflows.
Understanding the Cost of Downtime

Downtime is expensive. In industries like construction, mining, shipping, and agriculture, every minute that machinery or vehicles sit idle due to lack of fuel equals lost productivity and money. Consider the following consequences of unexpected fuel shortages:
- Delayed Project Timelines: If critical equipment runs out of fuel, workers may have to wait hours for resupply, throwing off schedules and delaying project milestones.
- Labor Waste: Skilled workers are still on the clock—even if they’re standing around. Fuel delays drive up labor costs for unproductive time.
- Equipment Strain: Inconsistent fueling or emergency fill-ups can lead to inefficient machinery use or improper fuel handling, increasing maintenance needs.
- Lost Revenue Opportunities: If your business can’t meet deadlines, you risk losing future contracts and damaging your reputation.
Downtime can cost industrial businesses thousands of dollars per hour. Fortunately, bulk diesel fuel delivery can eliminate one of the most common causes of delay: running out of fuel.
What Is Bulk Diesel Fuel Delivery?
Bulk diesel fuel delivery is a service where fuel providers deliver large quantities of diesel directly to a customer’s location, be it a central tank, job site, or directly into vehicles or equipment. It’s designed for businesses that use significant amounts of diesel on a regular basis and can’t afford to rely on traditional refueling methods.
Deliveries can be scheduled daily, weekly, or on-demand, and the service is highly customizable based on your operation’s fuel consumption patterns.
The Advantages of Bulk Diesel Fuel Delivery

Investing in bulk diesel fuel delivery offers a range of tangible benefits, especially when managing complex industrial operations. Here’s how it helps reduce downtime and improve overall performance:
1. Consistent Fuel Availability
Having a regular delivery schedule means your team never has to worry about running out of fuel. Trucks, generators, excavators, cranes, and other heavy equipment stay up and running without interruption. A dependable supply chain ensures that operations continue on schedule, even during high-demand periods or emergencies.
2. Reduced Travel and Refueling Time
One of the biggest hidden costs in traditional refueling is the time spent sending vehicles or workers to off-site fuel stations. This can take hours every week, especially if the nearest station is miles away. With fleet fueling in Corpus Christi, diesel is brought directly to your location, eliminating unnecessary trips and saving both time and labor.
3. Optimized Fleet Performance

When drivers have to detour to refuel, it not only delays schedules but also increases mileage, fuel consumption, and vehicle wear. On-site fueling ensures your fleet is ready to go when needed, helping you meet delivery windows and route plans more efficiently.
4. Enhanced Safety and Compliance
Fueling in-house can come with safety risks if your team isn’t trained in handling and storing diesel. Bulk fuel delivery providers follow strict environmental and safety standards. They handle transportation, transfer, and containment with professional-grade equipment and protocols, reducing the risk of spills and contamination.
5. Data-Driven Fuel Management
Modern fuel delivery services include detailed reporting, inventory tracking, and consumption analytics. This helps companies:
- Monitor fuel usage by equipment or driver
- Forecast future needs
- Identify inefficiencies or leaks
- Simplify billing and accounting
With these insights, managers can make smarter decisions, reduce waste, and plan budgets more accurately.
Fleet Fueling in Corpus Christi: Meeting Regional Demands

Corpus Christi is a major industrial center on the Texas Gulf Coast, with activity spanning shipping, logistics, energy production, and construction. The city’s infrastructure demands reliable, fast fuel access for companies operating large fleets and heavy machinery across wide areas.
Fleet fueling in Corpus Christi is especially valuable for operations that can’t afford delays. Coastal weather, fluctuating demand, and tight project timelines mean that companies need on-site fueling they can count on, day or night.
Key features of local fleet fueling providers include:
- 24/7 emergency fueling services
- Customized scheduling
- GPS-tracked deliveries
- Mobile fueling directly into vehicles or equipment
- Compliance with EPA and TCEQ regulations
By working with a regional provider like Mansfield Service Partners, Corpus Christi businesses benefit from fast response times and in-depth knowledge of local industry challenges.
Environmental and Economic Benefits

Beyond efficiency and uptime, bulk diesel delivery also supports sustainability and cost control.
Environmental Considerations:
- Fewer refueling trips reduce vehicle emissions.
- Professional handling minimizes the risk of fuel spills.
- Delivery services often use advanced routing to reduce fuel consumption on their end.
Cost Benefits:
- Buying diesel in bulk typically comes at a lower per-gallon price.
- Avoiding emergency fill-ups helps prevent inflated costs.
- Reduced downtime and improved fuel tracking save money long-term.
When Should Your Business Consider Bulk Fueling?

If your team is regularly refueling more than 500 gallons per week, it’s time to consider bulk delivery. Signs you’re ready to transition include:
- Repeated project delays due to fuel shortages
- High labor hours spent on refueling trips
- Inconsistent fuel costs
- Need for improved tracking and accountability
Whether you’re managing a construction company with multiple job sites or a logistics fleet serving the Port of Corpus Christi, partnering with a trusted fuel provider can dramatically enhance your operations.
Maximize Uptime with Bulk Diesel Fuel Delivery
In today’s competitive industrial landscape, minimizing downtime isn’t optional; it’s essential for profitability and growth. Bulk diesel fuel delivery offers a reliable, efficient, and cost-effective way to keep your machinery and fleet operating without interruption. By streamlining your fuel supply chain, you reduce labor costs, avoid delays, and optimize overall productivity.
For businesses in South Texas and particularly those depending on fleet fueling in Corpus Christi, the advantages of on-site fueling are clear. It’s not just about getting diesel, it’s about fueling your entire operation for success.
If you’re ready to take control of your fueling strategy and eliminate unnecessary downtime, consider making the switch to bulk diesel delivery. It could be the most impactful operational upgrade your company makes this year.
The post How Bulk Diesel Fuel Delivery Reduces Downtime for Industrial Operations appeared first on Energy Trends Insider.


Death of the Florescent Shop Light – Energy Efficiency 21 Sep 2022 4:50 AM (3 years ago)
I’ve recently discovered the reasonably priced LED shop light. “Big whoop” you may be thinking. It’s a bigger whoop than many realize, especially for me. Just for the fun of it, I measured the current draw of one of my old shop lights and one of the new LED versions. LED lights use 66% less energy.
This won’t make a meaningful, or possibly even a measurable difference in my electric bill but to put this into perspective, if you could achieve that level of efficiency improvement for all lighting in the country, from a CO2 emission perspective, it would be roughly equivalent to replacing about 7% of our fossil fuel power plants with renewable green lower CO2 emitting electrical energy sources, without having to build a single nuclear, wind, hydro, or solar power plant.
That’s more than today’s total for wind and solar combined. Put yet another way, that is equivalent to about 1,000 utility scale wind projects (48,000 wind turbines), or about 36 nuclear power plants. But before you toss back that shot of whiskey in celebration, understand that the 66% reduction I achieved with my shop lights would not apply to all lighting across the country.
Just last year the Nobel Prize was awarded to the three Japanese scientists responsible for creating the version of diodes that is used for lighting today.
The only downsides of note I found (and I’m sure there are more) are the fact that insects are more attracted to diode lights and that they don’t generate enough heat to melt the snow when used as traffic lights (easily resolved by not using diodes).
The insect problem appears to be potentially serious because insects are the key to nature’s food webs and I would hope that laws could be made to minimize their use outdoors where that is a concern.
Sigh …always the downsides. I recently read a book written by a retired Everglades wildlife ranger. Towards the end of the book he noted how much has changed. He recalled how the proprietors of the fishing camps had to use push brooms to clean the piles of insects off the sidewalks under the porch lights every morning.
Now, you may see a single moth or two flittering around those lights (mosquitoes are not attracted to lights). I recall as a child, the big outdoor light at my uncle’s farm attracting a riot of insects and bats every summer night. The Luna moths were my favorite. That farm, and the area around it, has since become a well-groomed, insect free, grassy place filled with second homes.

The shop light story begins in my man-cave (these used to be called workshops, or garages). A typical man-cave is unfinished, unheated (or barely heated), poorly lighted, with a concrete floor, oh, and with lots of spiders around …all necessary evils to limit female encroachment. It takes twenty four, four-foot long, 40-watt fluorescent tubes to light this space.
At any given time, a third of them were either dark, or flickering. In a corner sat dozens of burned out bulbs waiting to be taken to a hazardous waste disposal site. I have managed to break these bulbs uncounted times with an errant 2 x 4 or whatever, having the glass and mercury sprinkle down on my head. I hated these lights but could never come up with a better alternative until about a month ago.
A few times a year I would do a Google search for reasonably priced LED alternatives, but always came up short. On my latest attempt I discovered these lights for $59.99 at Home Depot and immediately bought twelve of them. The price, of course, has since dropped to $49.99. Always watch for when I buy a new piece of technology, be it a digital camera, an electric car, or LED shop lights because very shortly afterwards, the prices of those objects will plummet.
I looked up an equivalent conventional shop light at Home Depot that goes for $19.99 without bulbs. Screw the cost difference. I won’t have to replace a fluorescent tube, or any shop light for the rest of my life. And if I put a price on my labor and cuss words, these LEDs are a financial bargain as well.
The standard shop light design has been around for many decades and consists of a relatively heavy sheet metal (steel) reflector with the heavy ballast also contained in a sheet metal enclosure, all hanging by chains and hooks.
The design I chose is made entirely of plastic and weighs about as much as my coffee cup. Instead of chains, it comes with a cable that connects neatly to the light in a slot, with a loop on the other end for a hook on the rafters. It can also be mounted flush to the rafters without any cables or chains. I’m impressed that some creative engineer finally got around to improving the shop light. Now for the mousetrap.
The death of the curly bulb (CFL compact florescent light)
As a home owner, I’ve always also cursed the incandescent light bulb. It seemed like I was on a ladder or chair every other week or so, replacing another damned bulb. Many years ago, Seattle distributed free of charge, those newfangled curly bulbs to try out. The idea was to reduce energy use to avoid building more power plants. I threw mine away after trying it for a few weeks. It started out very dim, took too long to warm up, and had a strange color.
The government effort to accelerate acceptance of this new technology backfired. I was soured on those bulbs for longer than I should have been. Eventually, you could buy any number of white color variations and the warm up period was greatly reduced. Once I discovered that, I quickly replaced all of my incandescent bulbs simply because the curly bulbs lasted far longer. As with my shop lights, saving money or the planet had little to do with it.
Lo and behold, earlier this year Seattle sent me, free of charge, an LED bulb to try out. I was skeptical but replaced the next burnt out curly bulb with it and have been very pleased with the results. I’m done buying, and most importantly, replacing curly bulbs, or any bulb for that matter. I’m certainly not an expert on LED lighting, and I’m sure there are better products out there than these few I’ve recently stumbled on. I’m just very pleased with my new shop lights and wanted to share. It’s a glorious new age ; )
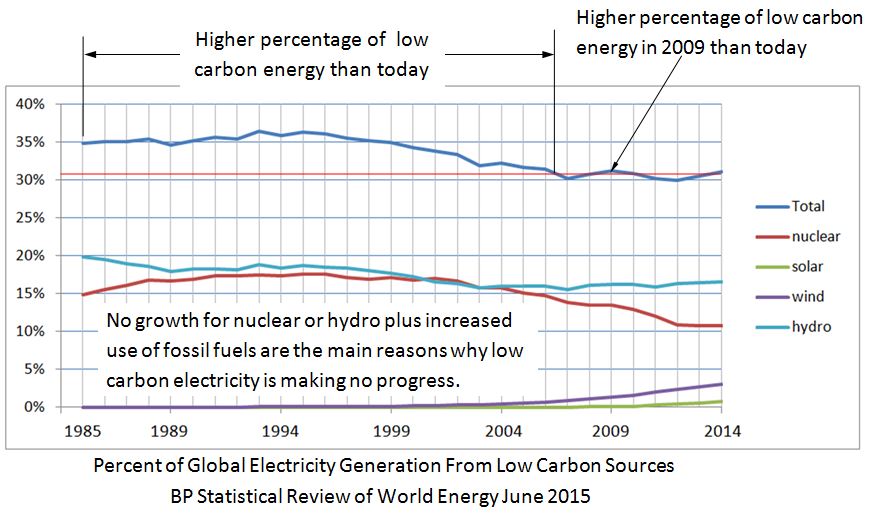
To transform global energy generation away from fossil fuels, we will need many more technological + economical leaps like LED lighting. The LED is an example of what the Google engineering team meant when it concluded that we need better technology; today’s renewable and nuclear technologies combined won’t cut the mustard. I used the data from the 2015 BP Statistical Review to create the following charts in an attempt to put the scale of the challenge into perspective.

The top curve represents total global energy consumption and the two lower curves represent total global solar and wind energy consumption over the last 50 years.

The top curve represents the sum of the four main low carbon sources of global electricity as a percent of total electricity consumption. Note that the sum of those four low carbon sources is less today than it was thirty years ago. No progress has been made. In fact, we’ve been losing ground for the last twenty years. Can you spot the reason why?
The post Death of the Florescent Shop Light – Energy Efficiency appeared first on Energy Trends Insider.
Methanol VS Ethanol – Technical Merits and Political Favoritism 21 Sep 2022 4:34 AM (3 years ago)
The previous essay sparked a lively discussion about the potential of methanol as a fuel, so I decided to write an essay particularly devoted to methanol. I was especially motivated to write this because of hypocrites who profess to be all about renewable energy and weaning the U.S. off of foreign oil – which explains their rabid support for corn ethanol – and then when the conversation turns to methanol they start to bad mouth it.
When talking about methanol, hypocrites will tell you that “it is toxic.” But these people have never raised that issue over highly toxic denatured ethanol. They speculate that capital costs will be low for cellulosic ethanol but high for methanol.
They complain about the lower energy density of methanol, but bring up ethanol and they will tell you all about the possibilities of designing engines to compensate for ethanol’s lower energy density relative to gasoline. Yet they don’t mention any possibility of optimizing engines for methanol. It simply has less energy. End of story.
They will talk about ethanol being pragmatic and practical, ignoring the fact that:
- The energy return on the process is very low, hence practicality is enabled by low fossil fuel prices;
- The “practicality” is only there because of heavy lobbying which led to very generous federal subsidies and mandates;
- The vision of next-generation practicality is because people sometimes make very wild extrapolations on costs for cellulosic ethanol (which we aren’t allowed to do with methanol, because after all, it isn’t practical).
Ethanol’s “pragmatism” is far more due to the fact that it has lobbying organizations like Growth Energy, The American Coalition for Ethanol, and the Renewable Fuels Association spending millions of dollars per year to constantly tell the public and the politicians how pragmatic ethanol is – which by the way we need to keep subsidizing and protecting with tariffs. Methanol doesn’t have that advantage, thus it is “impractical.”
Watch this video to understand how to distinguish between methanol and ethanol easily:
Let’s address some of the silliness right now.
As has been pointed out, you can buy methanol today for around $1.00 per gallon. This is a big, well-established business that does not receive heavy subsidies and government support as ethanol does.
On a per BTU basis, unsubsidized methanol costs $17.61 per million BTUs. You can buy ethanol today – ethanol that has received billions in taxpayer subsidies – for $1.60 per gallon. On a per BTU basis, heavily subsidized and mandated ethanol sells for $21.03 per million BTUs.
Yes, you read that correctly. We are paying 20% more for ethanol enabled via highly paid lobbyists, heavy government intervention, taxpayer funds, and protectionist tariffs than we are for methanol that has long been produced subsidy-free.
Yet ethanol is “practical.” (If we make that gallon per gallon comparison that ethanol proponents like to make when comparing gasoline to less energy dense ethanol, then ethanol costs 60% more than methanol).
Of course ethanol proponents will tell you that commercial cellulosic ethanol is just around the corner, as it has been for 100 years. Ethanol fans will point to projections of companies like Fiberight who suggest that someday they will produce cellulosic ethanol for $1.65 per gallon. “Ha! Top that!” – say the ethanol proponents.
The problem is that they do not understand the context of such projections. If I plug methanol into that same model – produce it from biomass and assume generous tipping fees – my methanol projections can come in at under $0.50 per gallon. But methanol doesn’t have a big lobby and 42 senators from farm states it can count on for perpetual support.
Ethanol opponents and/or gasoline proponents will point out the issue with ethanol’s 76,000 BTU/gal energy content versus gasoline’s 115,000 BTU/gal energy content. The ethanol proponents will say:
“But, but ethanol has a higher octane. Therefore you could design an engine with a higher compression ratio to even out that energy deficit.”
Then when the talk turns to methanol, those same people will say:
“But methanol has a lower energy content than ethanol.” These people are no longer interested in optimized engines; they only wish to point out that methanol has lower energy content.”
The fact is, methanol simply has not had the same sort of political favoritism, but is in my opinion a far superior option to ethanol as a viable, long-term energy option for the world. Here is why I believe that.
As already pointed out, we had a thriving methanol industry long before the government created (and continues to support) via our taxpayer funds a thriving ethanol industry. So in my opinion methanol wins the first generation battle on the technical and economic merits, and loses the very important political battle.
But the next generation is what is going to be important. Biomass only contains 30-50% cellulose, and a very large fraction of the biomass will be inaccessible for a cellulosic ethanol process. After a series of complex steps, a very dilute solution of ethanol can be produced, which then must undergo an energy intensive distillation process.
Of course you can use the remaining lignin fraction for process heat, after it undergoes an energy-intensive drying process. So I may project that I can produce it cheaply if I pretend someone is going to pay me a lot to relieve them of their biomass – but I will never, EVER, make it efficiently. That is simply the nature of the beast. But in my opinion a high utilization of the available BTUs will be a very high priority in an energy-constrained future.
For methanol, we can produce it from biomass via a similar process to how it is produced for $1.00 per gallon today. There are numerous biomass gasifiers out there. Some are even portable. They do not require high fossil fuel inputs and they utilize a much larger fraction of the biomass. They aren’t limited to cellulose. They gasify everything – cellulose, hemicellulose, lignin, sugars, proteins – all organic components.
And if there is also a heating application, the combined heat and fuel/power efficiency of a biomass to methanol via gasification route is going to put cellulosic ethanol to shame. In any case, the efficiency of biomass gasification to methanol is going to put cellulosic ethanol to shame, because it doesn’t have to deal with all of that water present in the ethanol process.
Finally, ethanol is inappropriate as a replacement for distillate fuels. Methanol, on the other hand, is easily converted to di-methyl-ether (DME), which is a very nice distillate replacement. China already has a big head start on the rest of the world, as they saw the potential for DME while the U.S. was spending billions to build an ethanol industry. (See my story: Keep Your Eye on DME).
So the next time an ethanol hypocrite tells you how good ethanol is relative to gasoline, but then turns around and tells you how bad methanol is relative to ethanol, you may want to explain that they have confused political favoritism for technical merits. (Or you can conclude that they have a vested ethanol interest).
When they explain how first generation corn ethanol is paving the way for cellulosic ethanol, point out that both first generation and second generation methanol will beat the cost of ethanol on a per gallon – and more importantly on an energy equivalent basis.
When they argue about methanol’s toxicity, ask them about the last time they drank denatured ethanol or gasoline (or how many people are impacted each year by alcoholism). When they point out that subsidized ethanol is becoming more competitive with gasoline, ask them if they have priced unsubsidized methanol lately. Such is the nature of hypocrisy. Their solution is good, and yours is bad even if it shares the same qualities as theirs.
The fact is, it isn’t a bias against ethanol that causes me to favor methanol. I favor methanol because my view is long-term, and not based on political favoritism or a half-cycle of the very cyclical energy industry. Ethanol has yet to even see one full cycle of the energy roller-coaster, which oil refiners can tell you is brutal.
Ethanol producers are further tied to the cyclical nature of commodity foods. For these reasons, I simply do not believe ethanol will be a viable long-term answer to oil depletion, and the only reason it appears to have promise now is we have the luxury of subsidizing and mandating the industry which remains heavily reliant on cheap corn and cheap energy.
Now if someone can figure out how to efficiently gasify biomass and convert it to ethanol (which was the Range Fuels model), I will certainly change my tune.
The post Methanol VS Ethanol – Technical Merits and Political Favoritism appeared first on Energy Trends Insider.
Bill Nye the Science Guy – Social Primate and Nuclear Energy 21 Sep 2022 3:43 AM (3 years ago)
An article last week in Business Insider discussed Bill Nye’s conversion from anti-GMO to pro-GMO (genetically modified organisms). According to Nye, while attending a political rally in NYC:
“…one speaker insisted that the US president Barack Obama was part of a conspiracy sponsored by large agriculture companies to control minds — and received a great many cheers — somehow that passionate man at the microphone crossed a line for me.”
Was it a desire to distance himself from conspiracy theorist nut-balls or was it the result of his exposure to facts by real scientists at Monsanto that finally convinced him to change his mind? If it was the latter then his stance was largely based on a lack of knowledge.
Some are hoping that because Nye was convinced to distance himself from anti-GMO ideologues that he may also one day distance himself from their anti-nuclear energy counterparts, as several highly visible environmentalists have managed to do over the last few years, but I’m skeptical. Nye was not nearly as invested in his GMO stance as he is in his anti-nuclear energy belief.
After reading the above article I typed in the search terms Obama Nuclear Conspiracy and found an article on a conspiracy theorist website titled Nuclear Power Plants–Can We Trust Government Agencies To Tell The Truth? From that article:
“Exelon, the largest nuclear power generator in the USA, was a generous financial supporter to get Barack Hussein Obama elected president. No wonder President Obama supports and promotes building more nuclear power plants.”
At the bottom (no pun intended) was the following crass political cartoon (I’ve censored it for the weak of heart) which encapsulates the big three; anti-GMO, anti-vaccination, and anti-nuclear energy, oh, and fluoride.

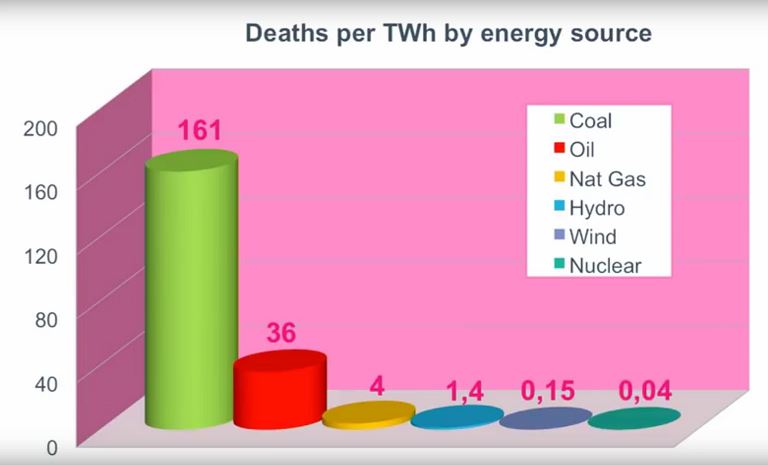
Bill Nye the comedian celebrity version of everyone’s favorite high-school science teacher, but funnier, and goofier, much goofier, still thinks nuclear energy is too dangerous while Sunniva Rose, a practicing nuclear physicist and real world embodiment of the lawyer character played by Reese Witherspoon in the movie Legally Blonde demonstrates in her TEDx talk that nuclear energy is actually (ironically?) the safest energy source we have.
Click here to see a video of Nye’s view on nuclear energy.
Bill Nye: “It may be that nuclear power, at our current level of understanding, is just inherently not safe enough.”
Sunniva Rose: “How is it possible to worry about global warming, and not be pro-nuclear?”
While the shock wears off, the laughing starts as you deduce that the guy doing back flips has to be a stunt double (which you then confirm with a quick Google search), but that fact was lost on the person publishing the video. In this case, all his lack of critical thinking cost him was a good laugh.
All anti-nuclear energy arguments have been losing ground since the advent of the Internet, where the truth can usually be found by anyone interested in finding it. The “nuclear power is unsafe” argument was one of the first to fall. For some reason, Bill never got that memo. Now, of course, you can lead a horse to water …but what about Fukushima?
Contrary to popular depictions (and the conspiracy website mentioned above), Fukushima was actually a test case that bolstered the nuclear safety issue.
Not a single fatality resulted from the power plant when, not one, but three reactor cores melted down as a result of a magnitude nine quake and 60 foot high tsunami that killed tens of thousands, devastating the surrounding countryside and infrastructure, severely limiting the ability to respond to the loss of water pumps keeping the reactors that had automatically gone off line from cooling down.
The above graphs cover the entire half century of nuclear power use in all countries around the entire planet. A nuclear power plant built in the sixties is about as technologically distant from a new one as your smart phone is from a transistor radio, a 707 from a 787.
What is science? One stripped-down definition might be the use of math to uncover reality. It’s close cousin, engineering, might be defined as the application of math and science to create technology. Back when Darwin first published his treatise, debating creationists was even more challenging because at that time Darwin had no idea what the physical mechanism was that caused change.
Today, thanks to the likes of Rosalind Franklin who managed to take X-ray diffraction images (worth a thousand words) of a DNA molecule that very likely gave the hint to Watson and Crick that helped them unravel the double helix structure of the molecule, we now know what that mechanism is.
The evolutionary process, it turns out, is raw mathematics. Around the world, organism genomes are unraveled and stored in computers daily. 2 + 2 = 4. That’s science. Nuclear energy’s safety statistics are undeniable.
Bill recently wrote a book about evolution called Undeniable: Evolution and the Science of Creation which made it to the New York Times best seller list …which pales in comparison to the seven books co-written by Jerry Jenkins, co-author of the Left Behind series of books that tell …“the story of the end times (set in the contemporary era), in which true believers in Christ have been “raptured“, (taken instantly to heaven) leaving the world shattered and chaotic,” that also reached the bestseller list (three of which made it to the number one spot).
Although the science behind evolution is undeniable, Bill is unlikely to ever get a creationist to cede the argument in large part because they are socially invested in their belief. The numbers don’t matter to them.
They are members of the creationist monkey troop and ceding that argument will get them excommunicated. In short, there would be a terrible social and emotional cost extracted. And one more thing, if you have ever debated a creationist you soon realize that a big part of the problem is a lack of knowledge as was the case with Nye’s change of opinion on GMOs.

As an aside, Nye’s book on the subject also pales in comparison to the works of an actual scientist:
- Dawkins, R. (1976). The Selfish Gene
- Dawkins, R. (1982). The Extended Phenotype.
- Dawkins, R. (1986). The Blind Watchmaker.
- Dawkins, R. (1995). River Out of Eden.
- Dawkins, R. (1996). Climbing Mount Improbable.
- Dawkins, R. (1998). Unweaving the Rainbow.
- Dawkins, R. (2003). A Devil’s Chaplain.
- Dawkins, R. (2004). The Ancestor’s Tale.
- Dawkins, R. (2006). The God Delusion.
- Dawkins, R. (2007). Richard Dawkins: How a Scientist Changed the Way We Think
- Dawkins, R. (2009). The Greatest Show on Earth: The Evidence for Evolution.
- Dawkins, R. (2011). The Magic of Reality: How We Know What’s Really True
- Dawkins, R. (2013). An Appetite for Wonder: The Making of a Scientist.
- Dawkins, R. (2015). Brief Candle in the Dark: My Life in Science.
Over the years I’ve read all but the last two of Dawkins’ books listed above. I’m presently in the middle of reading Appetite for Wonder. Not expecting to find any epiphanies like memes and selfish genes, I’m going to pass on Nye’s 300 page Reader’s Digest version.
Yesterday, I swung by my favorite bookstore. The employees are all bibliophiles and the new non-fiction tables are typically full of great books. I usually feel like a kid in a candy store and walk out with an armload, but not this time. I found one book of interest.
I noticed that roughly a quarter of the books were written by entertainment celebrities, which makes sense from a publisher’s perspective because they have a good chance of being profitable. A book written by Paris Hilton or Kim Kardashian would very likely be a best seller.
So, why does Bill Nye, a guy who purportedly lives and breathes science, continue to “believe” that nuclear energy is unsafe? Certainly, the numbers don’t justify his belief. As with his creationist counterpart, I suspect he was imprinted with this belief in his youth. The belief has defined him socially. His environmentalist monkey troop circle heavily overlaps that of the anti-nuclear energy monkey troop.
Ceding that argument may well get him excommunicated (Ed Begley might not want to be seen in public with him). There would be a social cost extracted. For this reason, convincing him to cease and desist parroting old (and new) anti-nuclear energy arguments may be just as difficult as getting a creationist to cede their arguments.
In short, Bill is, on this particular subject, as guilty of ignoring the science (numbers) as his creationist counterpart.
Watch this video so you can understand how bad is it really:
Today, what we call celebrity worship is probably a distortion of a basic behavior rooted in our genes that at one time somehow helped move copies of genes into the future. The behavior may have facilitated the status hierarchy inside hunter gatherer hominid troops …or not.
On the other hand, a modern day comedic celebrity publicly expressing his or her unqualified opinion on important topics can have a disproportional negative impact, like this comedian’s opinion of vaccination policy, or energy policy which in turn, thanks to climate change and assuming humanity is capable of doing anything about it, can have a negative impact on our children’s futures.
Such is human nature. The numbers have little impact on the beliefs of creationists, aging anti-nukers or new-age anti-vaccers.
Max Planck once said “A new scientific truth does not triumph by convincing its opponents and making them see the light, but rather because its opponents eventually die, and a new generation grows up that is familiar with it.”
Bill Nye once said “Don’t believe everything grownups tell you,” which includes what Bill tells you, although he may deny being a grownup.
Those anti-nuclear groups that have largely abandoned the difficult to defend safety argument have managed to do so in part because they’re confident they have found a more defensible one in the new cost argument (although it is nearly as weak as the safety one and I will try to get a post up on that topic).
This is a good thing overall in my opinion because jumping to the cost argument has made it easier to abandon other misconceptions (they still have an argument to cling to).
I’m a proponent of the use of wind and solar when properly sited, but it has been made very clear by many studies from reputable sources like the NREL, the EIA, and the Google R<C research team that they can’t replace all fossil fuel use without the assistance of existing nuclear technology and/or future technologies not yet proven to be commercially viable or not yet envisioned.
I’ve used a version of the following graphic before and I present it here again to demonstrate the lack of progress being made.
For similar posts, you can visit energytrendsinsider.com as we have more topics like this one.
The post Bill Nye the Science Guy – Social Primate and Nuclear Energy appeared first on Energy Trends Insider.
World’s Smallest Gasoline Engine – Technology Breakthrough 21 Sep 2022 3:21 AM (3 years ago)
While I try to be very careful about posting hype masquerading as a legitimate technology breakthrough, this story is too good to pass up (even though it contains a lot of hype). I don’t know about the prospects for commercial success (as I have said before, I have been waiting for my DNA computer for 15 years) but this story is interesting and topical:
New mini petrol engine

There is a copyrighted picture at the link showing the engine resting on a fingertip. Some excerpts from the story:
Scientists have built the smallest petrol engine — tiny enough to power a watch.
The mini-motor, which runs for two years on a single squirt of lighter fuel, is set to revolutionise world technology.
It produces 700 times more energy than a conventional battery despite being less than a centimetre long — not even half an inch. It could be used to operate laptops and mobile phones for months on end — doing away with the need for recharging.
Experts believe it could be phasing out batteries in such items within just six years.
I guess that depends on the prospects for mass production. If it takes a team of scientists and engineers to build each one, it won’t be replacing batteries any time soon. And the article mentions nothing about the difficulty of manufacture.
The engine, minute enough to be balanced on a fingertip, has been produced by engineers at the University of Birmingham. Dr Kyle Jiang, lead investigator from the Department of Mechanical Engineering, said: “We are looking at an industrial revolution happening in peoples’ pockets.
“The breakthrough is an enormous step forward.
“Devices which need re- charging or new batteries are a problem but in six years will be a thing of the past.”
Other applications for the engine could include medical and military uses, such as running heart pacemakers or mini reconnaissance robots.
Hmm. Not sure I want a combustion engine operating next to my heart, especially in light of:
One of the main problems faced by engineers who have tried to produce micro motors in the past has been the levels of heat produced.
The engines got so hot they burned themselves out and could not be re-used.
The Birmingham team overcame this by using heat-resistant materials such as ceramic and silicon carbide.
Anyway, regardless of whether it pans out, it is an interesting story and a neat technological achievement.
Be sure to check out our post on how high are gas prices.
The post World’s Smallest Gasoline Engine – Technology Breakthrough appeared first on Energy Trends Insider.
How Much Oil Does the World Produce? – Production Facts and Figures 21 Sep 2022 2:53 AM (3 years ago)
In the first installment of this series, I took a look at U.S. and global oil reserves according to the 2012 BP Statistical Review of World Energy. Today, I want to examine oil production statistics since 1965. Highlights of this article and topics that will be explored include:
- New global oil production record set in 2011, but the growth rate is slowing
- Global oil production has grown by 163% since 1965
- Production picked up in the U.S. again during President Obama’s first year in office
- U.S. share of global oil production dropped from 24% in 1970 to 9% in 2011
- Quality of oil produced today is lower than it used to be
World Oil Production Facts and Figures

The first graphic shows the growth in oil production from 1965 to 2011. A new global oil production record was set in 2011 at 83.6 million barrels per day. This figure includes production of crude oil and natural gas liquids (NGLs), which are not indicated separately. (In the U.S., around 25% of NGLs end up as refinery inputs; most of the rest is petrochemical feedstock).
Global production is lower than BP’s reported consumption figure of 88 million barrels per day (also a record) because the latter includes contributions from biofuels, fuels derived from coal, and any other fuels that are not derived from petroleum. Inventory changes would also be reflected in this number (i.e., one could in theory consume more in 2011 than was produced by drawing down inventories from 2010).
The data show that global oil production grew between 1965 and 2011 by 163%, which represents an average annual growth rate of 2.1%. While many were convinced that crude oil had peaked in 2005, production in 2011 was around 2.7% higher than the 2005 production level. However, the average annual growth rate from 2005 to 2011 was only 0.4%, far below the historical average.
Note that those who are projecting oil production in 2030 to be 100 million or 115 million barrels per day are assuming higher growth rates than have been seen in recent years. One must assume 0.95% average annual growth to get 100 million bpd in 2030, and 1.3% to get 115 million bpd in 2035.
Thus, even if you discount the possibility of an oil production peak, the recent slow growth — in the face of record oil prices — would result in oil production falling far short of those rosy projections. (To be clear, I do not believe 2030 oil production will exceed 2011 oil production).
President Obama: An Oilman in the Oval Office?
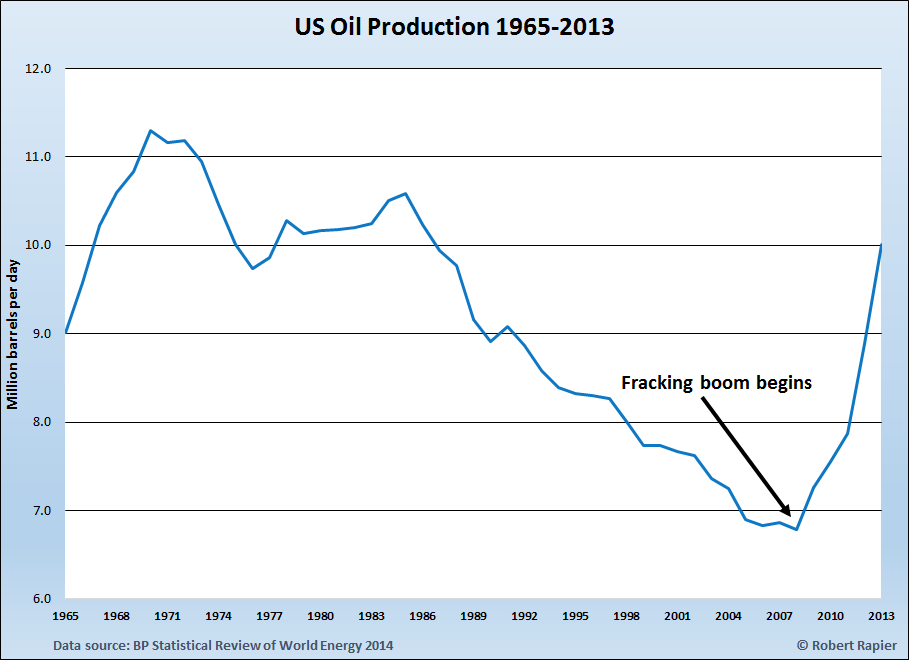
The next figure shows the history of U.S. oil production, which peaked in 1970 at 11.3 million barrels per day. Again, this includes roughly 2 million bpd of NGLs, which explains why the Energy Information Administration pegs the 1970 peak at 9.6 million bpd.

After 1970, U.S. production declined until 1977 when the Alaska pipeline began to operate. Following a few years of rising production as Alaskan oil production ramped up, the decline continued until 2008 when production reached 6.7 million bpd — 40% below the 1970 peak (per the BP data).
Then President Obama came riding to the rescue, and oil production has been rising ever since. At least that’s the story as I am sure it will unfold as the presidential campaign heats up. U.S. oil production in 2011 is in fact 16% higher than it was during the final year of the Bush Administration.
In reality, the rise in U.S. oil production is due to three factors: 1). Breakthroughs in hydraulic fracturing opened up new oil production opportunities in North Dakota and Texas; 2). Record oil prices resulted in record investments by oil companies for new production; and 3). Higher oil prices enabled more marginal oil to be produced (made possible by the first two factors).
Note that none of these factors are really influenced by the actions of U.S. presidents (although longer term, their policies can have significant impact). However, politicians like to take credit when things are going well, and point fingers when things are going badly, so I expect there to be a lot of rhetoric around this topic in coming months.
While we can debate the reasons, of one thing I am fairly certain. U.S. oil production will rise again this year, which means President Obama will have presided over 4 straight years of increasing domestic oil production. This will be the first time that has taken place since the administration of Lyndon B. Johnson.
U.S. Oil Production Compared to Rest of the World
The final graphic shows U.S. production in relation to the global total.

Because U.S. production has fallen over the years (even though production has been rising, 2011 production was still 31% below the peak level of 1970) and because global production has risen, the U.S. percentage of global crude production has declined from 24% in 1970 to 9% in 2011. Nevertheless, the U.S. is still the 3rd largest oil producer in the world, trailing only Saudi Arabia (11.1 million bpd) and Russia (10.3 million bpd).
But one very big difference between us and them is that they produce far more than they use, and therefore make lots of money exporting oil. We produce far less than we use, and so we spend a lot of money on imports (with some of that money going to Saudi Arabia and Russia).
One final note about oil production that gets very little attention is the fact that the 83.6 million barrels produced in 2011 is of a lower quality than the 32 million barrels produced in 1965.
Crude oil is getting heavier, contains more sulfur (i.e., is more sour) and requires more energy both to produce and to refine. While BP does not track this information, a quick look at the EIA data on crude oil quality confirms it. They only track the data back to 1985, but since then the overall mix of oil going to U.S. refineries is 5.5% heavier and contains 54% more sulfur.
The implications from this are: 1). Refineries have to become more complex to process this oil; 2). The net energy that can be obtained from a barrel of oil is declining; and 3). As a result the costs to process it are higher. This trend will continue as the world uses up the remaining supplies of light, sweet crude oil.
Link to Original Article: How Much Oil Does the World Produce?
The post How Much Oil Does the World Produce? – Production Facts and Figures appeared first on Energy Trends Insider.
World Sets New Oil Production and Consumption Records 21 Sep 2022 12:43 AM (3 years ago)
Last month BP (NYSE: BP) released the Statistical Review of World Energy 2014. This report is one of the most comprehensive sources of global and country-level statistics on the production and consumption of oil, natural gas, coal, nuclear power, and renewables.
Right after the release of the report, I wrote a short post discussing the highlights. Today I will take a deeper dive into oil production and consumption figures. In the coming weeks, I will delve into the rest of the report.
Oil Production
First a note about BP’s definitions. “Oil” in the BP Statistical Review (BPSR) is defined as ”crude oil, tight oil, oil sands, and natural gas liquids”, but excludes biofuels and liquid fuels produced from coal or natural gas. Consumption numbers do include all liquid fuels, so consumption numbers are always greater than production numbers, but this is merely an artifact of BP’s definitions.
Global oil production advanced in 2013 by 557,000 barrels per day (BPD), reaching a new all-time high of 86.8 million BPD (an increase of 0.6 percent over 2012). After declining in 2009, global crude oil production has now increased 4 years in a row.
But as I noted in last month’s short article, while global oil production did indeed set a new record, the US production increase alone was 1.1 million BPD. Thus, outside the US global production actually declined by 554,000 BPD.
The 1.1 million BPD gain in US oil production was the largest year-over-year gain for any country in 2013 and the largest gain in US history. For perspective, the second-largest increase in oil production was recorded by the United Arab Emirates with a gain of 248,000 BPD over 2012, and Canada was the only other country in the world to record an increase of more than 200,000 BPD, at 208,000 BPD over 2012.
The US remained the world’s third-largest oil producer at 10 million BPD in 2013, trailing Saudi Arabia’s 11.5 million BPD and Russia’s 10.8 million BPD. Rounding out the top five were China (4.2 million BPD) and Canada (3.9 million BPD).
Just to put the current US oil boom into further perspective, over the past five years global oil production has increased by 3.85 million BPD. During that same time span, US production increased by 3.22 million BPD — 83.6 percent of the total global increase.
Had the US shale oil boom never happened and US production continued to decline as it had for nearly 40 years prior to 2008, the global price of oil might easily be at $150 to $200 a barrel by now. Without those additional barrels on the market from (primarily) North Dakota and Texas, the price of crude would have risen until supply and demand were in balance.
Libya had the largest decline of any country due to military action there. Oil production fell in Libya by 521,000 BPD, a 35 percent loss from 2012. Production in Iran was down nearly 200,000 BPD, while military action also impacted Syria’s production, which fell 115,000 BPD. Production in Saudi Arabia and Nigeria was down about 100,000 BPD from 2012.
Oil Consumption
Oil accounted for 33 percent of all the energy consumed in the world in 2013. Globally, oil demand increased by 1.4 million BPD over 2012 to 91.3 million BPD, keeping upward pressure on crude prices throughout the year.
After two years of declines, US consumption increased by 397,000 BPD – a 2 percent increase from 2012. While much has been made of a slowdown in China, oil demand there still increased by 390,000 BPD (following a 500,000 BPD increase from 2011-2012). Despite the slowdown in the rate of growth from the previous year, this represented a 3.8 percent consumption increase for China, 2.5 times the global increase of 1.4 percent.
Together the US and China were responsible for 56 percent of the global increase in oil demand in 2013. The big difference between the two countries is that US oil production was up far in excess of our increase in consumption, while oil production in China edged up by only 24,000 BPD.
This means that while US oil imports declined and finished product exports (e.g., gasoline, diesel, jet fuel) increased, China’s dependence on oil imports continued to increase.
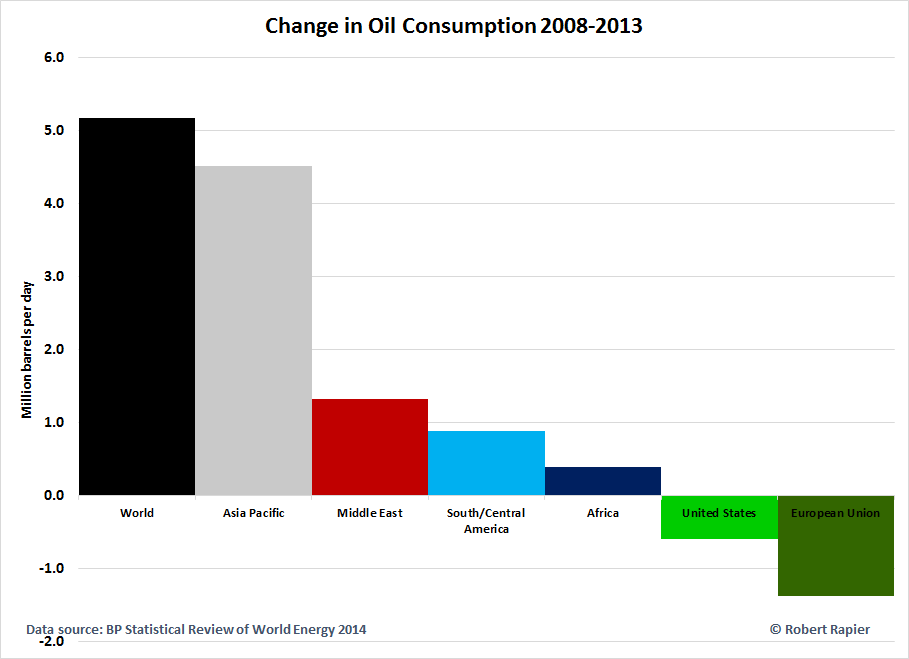
Double-digit percentage increases in oil consumption were recorded by Pakistan, Venezuela, and Azerbaijan from 2012 to 2013, and over the past five years, double-digit percentage consumption increases were recorded in Central and South America (15.2 percent), the Middle East (18.3 percent), Africa (12 percent), Asia Pacific (17.4 percent), and the former Soviet Union (12.8 percent).
Oil demand in the developed countries belonging to the Organisation for Economic Co-operation and Development (OECD) decreased 5.3 percent over the past five years, while demand in non-OECD countries increased by 20.3 percent.
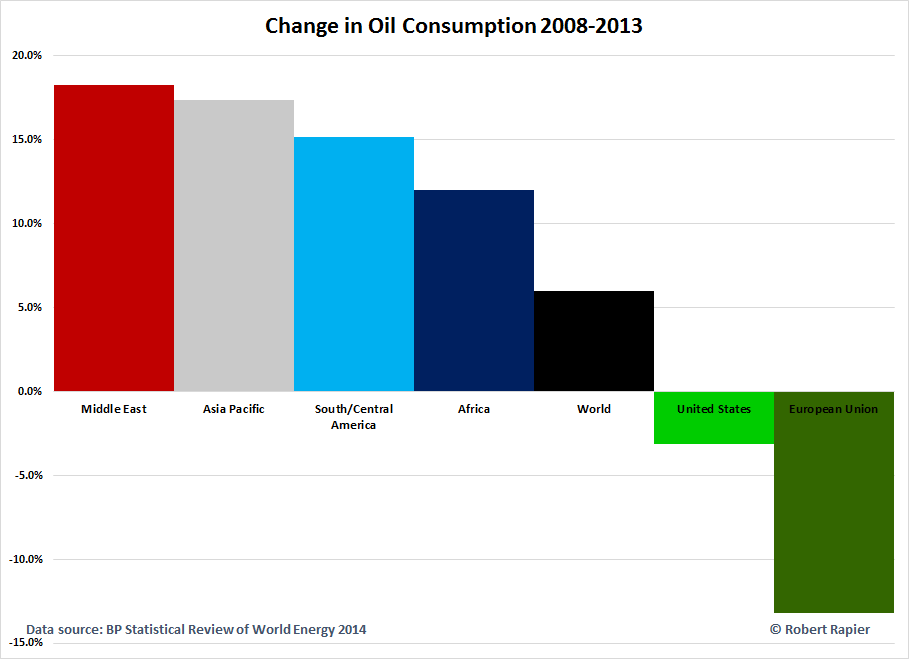
After posting the above graphic to my Twitter feed, several asked if I would reproduce it in barrels per day. I have to agree that this really puts Asia Pacific’s influence on global oil demand growth in perspective. Over the past 5 years, 87 percent of the demand growth for oil came from the Asia Pacific region:
Oil Prices
The loss of oil production from Libya and strong demand in developing countries ensured that oil prices remained high, despite surging US production. Contrary to expectations — given a tighter supply/demand picture for international crudes — Brent crude declined by $3.01 from 2012 to a yearly average of $108.66/bbl.
Prices for West Texas Intermediate (WTI), on the other hand, actually averaged $97.99/bbl for the year, an increase of $3.87/bbl from 2012.
Conclusions
The story of oil in 2013 was one of surging US production and increasing demand in developing countries. The US continues to lead the world in increasing oil production, while developing countries — in particular, the Asia Pacific region — have added the vast majority of oil demand in recent years.
Arguably the only thing preventing the world from experiencing oil prices in the $150-$200/bbl range is the continuing shale oil boom in the US.
The post World Sets New Oil Production and Consumption Records appeared first on Energy Trends Insider.
What Makes Up the Cost of a Gallon of Gasoline? – Gas Price 21 Sep 2022 12:33 AM (3 years ago)
Gas Price Breakdown: It’s All About the Cost of Crude Oil
“What am I paying for in a gallon of gas?” is a question on people’s minds and often posed by regular visitors to Consumer Energy Report. With the assistance of the Energy Information Administration, who provided the data (see the methodology they used for calculating the component percentages at the end of this column), I was able to break it down into a series of charts from 2000-2012.
For a more detailed look into the recent spike in gas prices, see: Charting the Dramatic Gas Price Rise of the Last Decade

The stat that jumps out the most in Figure 1 is the major shift in the share of crude oil toward the cost of a gallon of gas since 2000. In February 2000, when gas was selling for $1.38/gal, crude oil accounted for 45%; by the end of 2011, by which time gas had more than doubled to $3.27/gal, that share had gone up to an astounding 80%.

Figure 2 takes a closer look at the at the crude oil component’s incessant rise from 2000-2012.
Taxes Lose Influence

Figure 3 suggests that lowering gas taxes — as we often hear some state and federal officials proposing to the delight of their constituents — will not do as much to lower gas prices as people think. The taxes share of gas prices have gone down from 30% in 2000 to just 12% by the end of 2011.
Crude Oil Steals the Pie

The pie charts in Figures 4 and 5 show the significant changes that occurred between February 2000 and January 2012. The most noticeable change was the jump in the share of crude oil, followed by the drops in taxes and refining.

Methodology For Gasoline Fuel Pump Components
The components for the gasoline fuel pumps are calculated in the following manner in cents per gallon and then converted into a percentage:
- Crude Oil – the monthly average of the composite refiner acquisition cost, which is the average price of crude oil purchased by refiners.
- Refining Costs & Profits – the difference between the monthly average of the spot price of gasoline (used as a proxy for the value of gasoline as it exits the refinery) and the average price of crude oil purchased by refiners (the crude oil component).
- Distribution & Marketing Costs & Profits – the difference between the average retail price of gasoline as computed from EIA’s weekly survey and the sum of the other 3 components.
- Taxes – a monthly national average of federal and state taxes applied to gasoline or diesel fuel.
It should be noted that the second and third components can vary widely, depending on the time when the components are being calculated. Since there is typically a lag between when the spot price changes to when the retail price changes, the refining costs & profits component and the distribution & marketing costs & profits component can vary from month to month.
For example, as prices increase on the spot market, often the retail prices take time to adjust. Thus, at this point in the cycle, the refining costs & profits component (assuming no corresponding increase in crude oil prices) would be relatively large while the distribution & marketing costs & profits component would be relatively small.
However, later on, as retail prices “catch-up” with the previous spot price increases, the distribution & marketing costs & profits component would increase while the refining costs & profits component would decrease.
The post What Makes Up the Cost of a Gallon of Gasoline? – Gas Price appeared first on Energy Trends Insider.
Road Trip – Thoughts on the Satsop Nuclear Power Station 21 Sep 2022 12:21 AM (3 years ago)
My wife and I recently took a weekend road trip to view the annual shore bird migration along the Washington coast. Because it was along our route, we made a short stop in the town of Satsop.
Cooling Towers
The above image of a cooling tower was taken at the unfinished Satsop nuclear power station, which is now serving as a development park. Use your left mouse button to click here to see a higher resolution image and then left click once again on that image to see an even higher resolution photo of this cooling tower. Now employ your mouse wheel to scroll up and down that high resolution photo. Use the stairs zigzagging along the side to get a sense of scale.
Many people associate this type of large cooling tower with nuclear power plants, I’m guessing, because they make dramatic copy. But this type of cooling tower can be used with any thermal power plant regardless of energy source: solar, coal, biomass, natural gas, oil etc. From the Wikipedia article on cooling towers:
These designs are popularly associated with nuclear power plants. However, this association is misleading, as the same kind of cooling towers are often used at large coal-fired power plants as well.
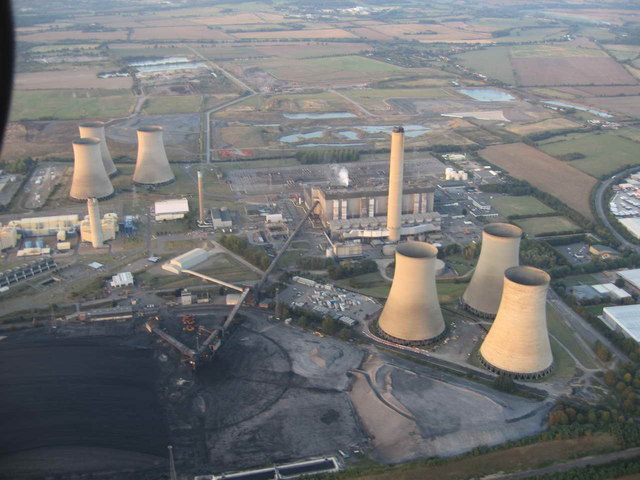
The Didcot power station pictured above burns a combination of coal, natural gas, and oil. Note the use of six hyperboloid cooling towers. Cooling towers are used to condense the steam exiting the steam turbines back into liquid water to be converted into steam again and sent back through the turbines. This greatly reduces the amount of water lost as steam.
How do they work? Essentially the rising steam creates a natural draft like your fireplace (ambient air is pulled in at the bottom). The steam must pass through a plastic grid that is being sprayed with water, which in turn, causes the steam to condense back into water. This strong natural updraft negates the need for fans to move the steam. One might guess that the hyperboloid shape may have something to do with the Venturi effect, but in reality, the shape is primarily for structural efficiency (load resistance at a minimum cost). Cylindrical cooling towers are not as wind or earthquake resistant for the amount of material they contain. Click here to see a YouTube video of the inside of a working cooling tower that uses fans.
The Reactor Containment Structures
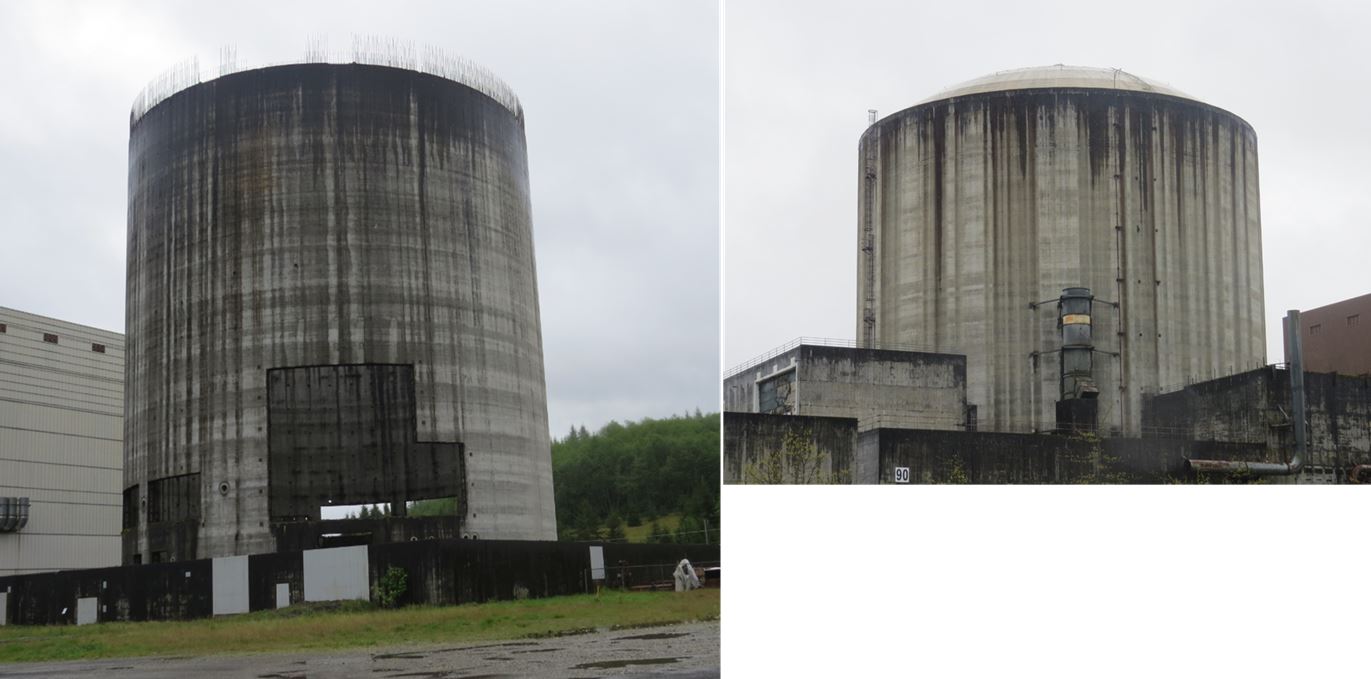
To get a sense of scale, note the eight foot high fence around the reactor containment structure on the left. I’m always amazed by how diminutive the containment domes are–smaller than many oil, or municipal water storage tanks.
These house the heart of a nuclear power plant; the reactor vessel which contains the nuclear fuel rods that boil the water to make the steam that spins the giant pinwheel (steam turbine) that is connected to the electric generator the sends electricity over the grid to our homes and cities. This is also the only part of a nuclear power plant that is different from other thermal power plants that use a different heat source (coal, biomass, natural gas, solar, geothermal).
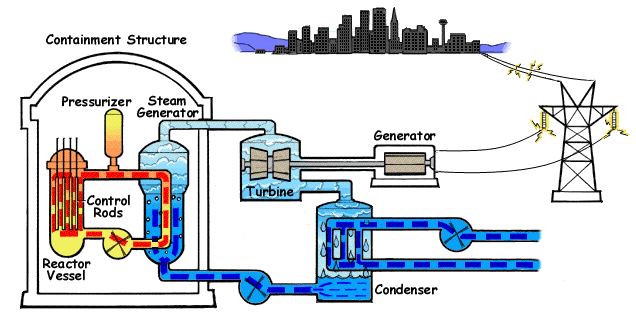
Click here to animate the above schematic. Coincidentally, that looks an awful lot like the Seattle skyline.
The Difference Between a Nuclear Reactor and a Nuclear Power Plant/Station
The terms “nuclear reactor” and a “nuclear power plant” are often used interchangeably, which can be confusing because they are not the same thing. A power plant (sometimes called a power station) may have more than one nuclear reactor (each inside its own containment structure) on site. The Fukushima power plant has six reactors (each inside a steel and concrete containment structure, which is in turn housed in a sheet metal outer building).
Although three of the Fukushima power plant reactors were damaged beyond repair when a tsunami overwhelmed the emergency cooling pumps, the other three reactors could, in theory, still be used by the power plant to produce electricity. The Chernobyl nuclear power plant (the poster child for how to do nuclear energy wrong) continued to produce electricity using its other reactors for well over a decade after one reactor (which had no containment dome) experienced a meltdown.
A Brief History of the Unfinished Satsop Nuclear Power Plant
For those of you too old to remember, or too young to have watched it unfold, Satsop was one of the four nuclear power stations (and their five reactors) involved with the WPPSS (Washington Public Power Supply System) debacle. From Wikipedia:
Energy Northwest (formerly Washington Public Power Supply System) is a United States public power joint operating agency formed by State law in 1957 to produce at cost power for Northwest utilities. Headquartered in Richland, Washington, the WPPSS became commonly known as “Whoops” due to over-commitment to nuclear power in the 1970s which brought about financial collapse and the second largest municipal bond default in U.S. history. WPPSS was renamed Energy Northwest in November 1998.
Note the term “produce at cost.” This is a Washington State not-for-profit joint operating agency, which should take some wind out of the sails of the anti-nuclear energy crowd who typically portray the operators of nuclear power plants as profit hungry conspirators. These guys were simply incompetent bureaucrats. From Wikipedia:
The directors and the managers of the system had no experience in nuclear engineering or in projects of this scale. System managers were unable to develop a unified and comprehensive means of choosing, directing, and supervising contractors. One contractor, already shown to be incompetent, was retained for more work. In a well-publicized example, a pipe hanger was built and rebuilt 17 times.
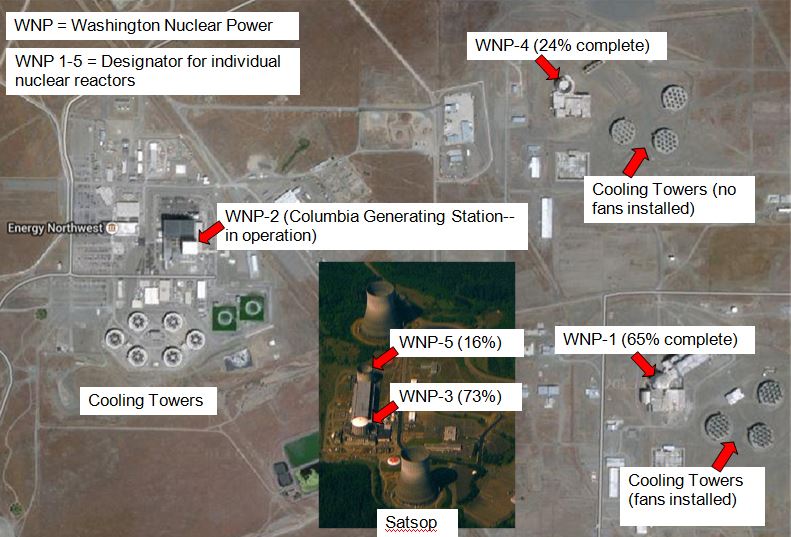
There were four proposed nuclear power plants. Click here for a photo and quick facts about each. Three of them were to have a single reactor and one (in Satsop) was to have two reactors (containment domes shown above) for a total of five reactors. Out of the four planned power plant/stations, only one was completed and is now called the Columbia Generating Station.
Note in the above graphic I put together (to better understand what had gone on) how radically different each power station is from the other. They have three different containment structure designs as well as three different cooling tower designs, and probably different everything else on the inside as well …unbelievable. The French and Canadians used one design which they repeated over and over again. The cost to build the first 777 airliner was astronomical. Imagine the expense of building a different airliner from the ground up for every customer.
Consumers of course had to pay for this boondoggle, but even so, we still have the lowest rates in the country. The fact that rates vary a great deal from state to state is largely a measure of how badly managed their utilities have been (number of power plants built but not needed). Click here for a list of 150 or so canceled, abandoned or on hold non-nuclear thermal power plants. Proponents of any given energy scheme be it wind, solar, or coal will high-five each other when a planned nuclear plant gets canned.
Who predicted that fracking was going to usher in an era of cheap natural gas? If you were planning to build a wind farm to reduce the fuel bills of your new natural gas power plant, you might need to cancel the plans for the wind farm if it now costs more to build than it will save you in fuel bills. Almost as if to rub salt in a wound, a natural gas power plant was built adjacent to the defunct Satsop nuclear power plant to take advantage of the power lines that had been installed. Fossil fuels win again!

The post Road Trip – Thoughts on the Satsop Nuclear Power Station appeared first on Energy Trends Insider.
What Happened at Choren? – History & Events 20 Sep 2022 5:44 AM (3 years ago)
If you have not heard by now, Choren Industries has begun bankruptcy proceedings. For those who don’t know, since 2009 I have worked as the technology advisor for the major investor and primary funding source for Choren’s day-to-day operations.
I have just returned from a visit to their plant in Freiberg, Germany. Due to the nature of my relationships with my employer and with Choren, I have to be guarded about what I say. To be clear, I do not work for Choren, and thus am not writing this as a Choren spokesman of any sort. But I do want to shed a bit more light on the situation.
First of all, to give a bit of background on Choren, the company’s roots go back to 1990. You can read their entire history on Choren’s website, but here are the highlights.

- In 1998, Choren completed a pilot plant in Freiberg, Germany where they first produced methanol, and then later gas for electrical power and finally Fischer-Tropsch diesel. They tested a number of different feedstocks, including wood. That pilot plant ran from 1998 to 2004, and fuel was supplied to DaimlerChrysler and Volkswagen for fleet testing. Operating data were also being gathered to scale up the process.
- Scale-up from the pilot plant was begun in 2003 at the Freiberg site. The gasifier would be scaled up from the pilot plant scale of 1 MWth to 45 MWth.
- Shell’s Fischer-Tropsch technology was being used in the plant, and in August 2005 Shell became an investor in Choren. Daimler and Volkswagen later joined as investors. One of the consequences of Shell’s investment was that the plant — still under construction — had to be brought up to Shell’s safety standards. This was absolutely the right thing to do, but it caused a delay in the construction of the plant. Additional safety standards were implemented in the wake of the BP accident in Texas City that killed 15 people. Once more, this was the right thing to do, but caused delays and additional costs.
- I personally became aware of Choren in 2007, and made a visit to their Freiberg plant in April 2008 (documented here) from my home at that time in the Netherlands. I was generally impressed with what they were doing, but I also raised questions around costs. My conclusion at that time was that they would eventually work out the kinks, but I thought it could take a while.
- In 2009, I accepted a job as Chief Technology Officer for the man who is presently the largest shareholder of Choren (although to be clear, Choren is not his only investment). Before I accepted the job we had a lot of philosophical discussions about the difficulty of scaling up new technology, as well as the amount of time it takes to do so. We both shared a belief that oil prices are inevitably headed much higher, and in that case we both believed the Choren process would be ultimately economically viable.
- Choren also started commissioning the gasification section in 2009. Thus began the long process of running for a period of time, and then shutting down and making adjustments. One of the biggest challenges in doing this is that there is no blueprint; nobody had run a gasifier like this at this scale on a biomass feedstock. So the plant had to work through many new technological challenges, and with a staff of 290 employees, the time it took to work through the issues was costly.

Because they had elected to forgo government funding, private investors have borne the development costs over the past few years. Several of those investors — including Shell — have exited at various points due to the time and cost it was taking to work out the technical issues. Ultimately, my employer was largely funding the ongoing operations of Choren from his pocket.
While the plant has made good progress, commissioning took far longer than expected. I had in fact warned that it would take at least a year to start up the plant once it was mechanically complete, but it was taking even longer than I expected.
It finally got to the point that all investors decided to stop funding development because all of the technical bugs had not been worked out. It wasn’t that there were any technical show-stoppers, it was just that the timing of how long it would take to work through the issues was uncertain.
Comparison to Range Fuels
It is inevitable that some will compare this situation to that of Range Fuels. However, there are some very important differences. First and foremost, I made it very clear that my criticisms of Range Fuels were never about failing. As my February 2010 essay on Range Fuels explicitly stated:
I want to make one thing crystal clear. I am not criticizing failure here. That is normal and expected. Failure is a part of what it takes to learn and move forward. What I am criticizing is the nature of the failure; that it was primarily because inexperienced people were making claims they shouldn’t have made, and taxpayers are going to get stuck with the bills. Personally, I have a problem with my tax dollars being squandered away by smooth-talking salesmen.
The fact is that most biofuel ventures based on new technology are going to fail. That is the nature of technology development. I have been involved now three times at some stage of scaling up technology from the lab to a demonstration or commercial scale (four if I include a retrofit to an existing butanol unit that I piloted and ultimately commissioned at full scale).
There are always challenges to be overcome, and often those challenges are show-stoppers. I know firsthand the nature of these challenges, which is why it drives me crazy to hear people talk of producing fuel for $1 a gallon when they haven’t even built any sort of demonstration facility.
But some are more realistic about the risks of developing new technology, and therefore they don’t make wild, over-hyped claims that have little basis in reality. Choren had very little to say in the press, preferring to just work on their issues and attempt to get the technology running.
That is one of the things I most admired about the company. For most of Range Fuels’ lifetime, they lived by the hyped-up press release and made numerous claims that simply were not credible. On the back of those claims, they drew in and squandered a lot of taxpayer money.
While Choren chose to develop without the benefit of government money, acceptance of government money was also never the basis of my criticisms of Range (or other technology ventures). It is simply that when one does accept tax dollars, there needs to be some accountability for the hype. My criticisms are the circumstances under which funding via tax dollars is achieved; that is whether tax dollars are obtained essentially on the basis of groundless claims.
In that case, companies are rewarded for hype, and the public is therefore bombarded by endless hype about solutions to our energy problems that never materialize. This is dangerous because it diminishes what I believe is a sense of urgency in developing real energy solutions. After all, where is the sense of urgency when 20 companies are all promising that they have the solution in hand? At least one of them has to be credible, right?
Where to Now?

At this point, Choren is looking at several options so they can carry on with the process of commissioning the technology. At present, I don’t know whether I will have any role in future Choren developments. I continue to believe that the long-term future of gasification is bright, and have cited on several occasions the fact that there are natural gas and coal gasification facilities around the world producing at scales of tens and even hundreds of thousands of barrels per day. So this is a technology that I view as far more scalable than most biofuel options that are on the table.
The catch is that it is more difficult to gasify biomass than it is to gasify natural gas or coal and produce syngas of a high enough quality for fuel synthesis. (Gasifying biomass isn’t hard really, but getting the right hydrogen/CO ratio and a high enough purity is where the challenges lie).
The Choren technology works, as demonstrated by years of run time at a smaller scale. But as I always warn people, scale-up issues can take some time to work through. When you first start up, there are a hundred little problems. You shut down, fix them, and restart to find there are still a dozen problems. You continue this process until all of the problems are solved, and then comes the challenge of running reliably for an extended period of time.
Sometimes, there are knockout factors as technologies are scaled up. That wasn’t the case here; as I said the gasifier has accumulated thousands of hours of run time at a demonstration scale. Technical challenges have been solved in a systematic manner, and to date all of the challenges I have seen are solvable. The only questions are around the amount of time and money it will take, and whether either are in sufficient supply to allow the commissioning to finish.
For more educational posts like this one, you can always visit energytrendsinsider.com.
The post What Happened at Choren? – History & Events appeared first on Energy Trends Insider.